Análisis de la rentabilidad económica de un sistema de gestión de presiones
4 de enero de 2011
Introducción
El objetivo de todo sistema de distribución de agua potable es suministrar agua a los abonados con la requerida calidad. La calidad del suministro debe referirse tanto a parámetros hidráulicos, en particular suministrar el caudal requerido a una presión adecuada, como a parámetros sanitarios, por ejemplo asegurar una correcta concentración de desinfectante o unos niveles bajos de contaminantes.
Siguiendo el criterio de que el agua llegue con una presión suficiente a lo largo del día en el punto más crítico del sistema, se producen presiones más altas que las necesarias durante los períodos en que la demanda no es punta, y en aquellos puntos que tienen mejores condiciones hidráulicas. La gestión de presiones tiene por objetivo reducir este exceso de presión, lo que produce un funcionamiento más homogéneo de la red, y una reducción en el caudal de fugas y en la aparición de roturas. En este artículo se pretende analizar la viabilidad de la implantación de un sistema de gestión de presiones, desde el punto de vista de la rentabilidad económica, analizando los costes que implica su instalación, y los beneficios que produce.
Beneficios e inconvenientes
La decisión de la implantación de un sistema de gestión de presiones pasa por comparar los beneficios que se obtienen con los costes que se originan. Si la inversión inicial se realiza de forma eficiente y los costes de mantenimiento y conservación se minimizan, entonces los beneficios serán máximos y la gestión de presión estaría justificada en la mayoría de los casos. Hay que destacar, tal y como ocurre en la mayoría de las actividades económicas, los rendimientos marginales serán decrecientes, es decir: los beneficios disminuirán cuanto más recursos se destinen, y por lo tanto menor será el grado en términos de agua ahorrada.
Los principales beneficios que se pueden conseguir son:
· Reducción caudales de fuga: como se sabe, el caudal que se fuga por un orificio es proporcional a un cierto exponente de la presión. Por tanto una reducción en la presión, significa una disminución en los caudales fugados. Ésta afecta tanto a las fugas latentes como a las producidas por las roturas.
· Reducción de la frecuencia de rotura: la presión no sólo afecta al caudal de las fugas, sino que también puede tener un efecto significativo en la frecuencia con la que aparecen las fugas y roturas, lo que representa a menudo el aspecto económico más interesante cuando se pretende llevar a cabo un programa de gestión de presiones.
· Reducción de algunos componentes del consumo: evidentemente todos aquellos consumos que dependen de la presión, tales como grifos, duchas, o riego se verán reducidos por la disminución de la presión. Es importante destacar que en general se considera la tendencia de dejar un grifo abierto más tiempo a caudal más bajo, está más que compensado por el caudal reducido, de forma que el volumen total consumido es menor.
· Presión de suministro más uniforme: sin una gestión de presiones, la presión de suministro a los abonados es función de la de entrada al sistema, menos las pérdidas de carga a la red de distribución. Teniendo en cuenta esto, la presión puede variar considerablemente entre el día y la noche y entre los diferentes días de la semana.
· Reducción de los costes energéticos: la reducción de la presión del sistema a menudo conlleva el beneficio de disminuir los costes energéticos, como consecuencia de reducir el consumo de los equipos de bombeo cuando se realiza la inyección directa del agua a la red.
Entre los inconvenientes cabe destacar los siguientes:
· Dificultad en encontrar las fugas: al haber menos presión, las fugas hacen menos ruido, y cuestan más hallarlas.
· Mantenimiento: la instalación de los equipos necesario para realizar la gestión de presiones implica un mantenimiento para que funcione de forma adecuada.
· Disminución de los ingresos: la reducción del consumo, supone también una merma en los ingresos que percibe la compañía suministradora.
· Calidad del agua: el cierre de las válvulas de contorno de los sectores puede producir ramales ciegos que ocasionen problemas de baja calidad del agua.
Sistemas de Control
Entre las diversas opciones para implantar un sistema de gestión de presiones, quizá una de las más utilizadas es mediante la instalación de válvulas reductoras de presión. El funcionamiento de estos dispositivos es producir una pérdida de carga de forma que se reduce la presión a la salida de la válvula. En la actualidad, existen dispositivos que permiten obtener una presión variable a la salida de la válvula, en función de la hora, del caudal circulante, o de la presión en otro punto del sector. Los sistemas de control más frecuentes son los siguientes:
· Salida fija: este es el método tradicional de control, mediante el cual la presión de salida de la válvula se mantiene en un valor fijo de forma que, bajo las condiciones de caudal punta, se obtenga una presión mínima en el punto crítico. Esta opción es la más barata de instalar, y requiere un mínimo mantenimiento. Cuando las válvulas se instalan con una presión de salida fija, la pérdida de carga producida en el sector supone que las presiones en los puntos de consumo variarán de acuerdo con la demanda de los usuarios.
Por lo tanto, este tipo de válvulas es efectivo para zonas con bajas pérdidas de carga, demandas que no varían mucho estacionalmente, y características de presiones uniformes. En otras zonas pueden ser ineficientes, ya que las presiones de salida tienen que fijarse lo suficientemente altas como para que se satisfagan las presiones mínimas en el punto crítico durante la demanda punta. A medida que la demanda del sistema disminuye, normalmente por la noche, las pérdidas de carga en el sistema se reducen y la presión del sistema tiende hacia la presión estática, que en muchos casos resulta excesiva para satisfacer la demanda nocturna y la demanda de protección contra incendios.
Las desventajas derivadas de este sistema podrían ser corregidas si el sector se alimentase desde dos o más puntos, de forma que se redujesen considerablemente las pérdidas de carga, con respecto a su valor para un único punto de alimentación. Esta solución no siempre se puede llevar a la práctica debido a la posibilidad de interacción entre las válvulas, como consecuencia de una falta de resistencia en el sistema, que tienda a cerrar una de ellas. En general, una única VRP puede ser la solución más adecuada cuando las pérdidas de carga entre la válvula y el punto crítico sean menores de 10 m bajo cualquier condición de caudal. (UK Water Industry, 1994g).
· Modulación basada en el tiempo: este es el sistema más simple para realizar un control avanzado de la presión y también el más barato. Se realiza mediante un dispositivo de control que dispone de un reloj interno, de manera que se varía la presión de tarado de la válvula en función de la franja horaria del día, de acuerdo con el patrón de demandas. Se trata de un método efectivo para realizar la reducción de presión en aquellos sistemas en donde existe un patrón constante de demanda diaria, pudiendo ser una solución óptima para reducir el exceso de presiones por la noche, cundo la mayoría de los usuarios se encuentran durmiendo (conticinio) y la demanda es mínima.
Este sistema tiene el inconveniente que ante una variación repentina de caudal (por ejemplo, debido a una demanda para protección contra incendios) durante las horas en que la presión de salida de la válvula es más baja, el sistema de control es incapaz de responder a la nueva situación, lo que puede dar lugar a que las presiones en la zona sean bajas, a menos que la presión de salida sea fijada con un margen de seguridad suficiente para garantizar el nivel mínimo de servicio ante dichas situaciones, lo que conllevará un cierto exceso de presiones en condiciones normales.
· Modulación basada en el caudal: este sistema proporciona una mayor flexibilidad que el anterior, aunque en contrapartida tiene un coste que puede ser aproximadamente el doble. Mediante este sistema se puede controlar la presión a la salida de la válvula de acuerdo con la demanda del sistema, por medio de la conexión del sistema de control a un caudalímetro que se encuentre próximo a la válvula. De esta manera, la pérdida de carga que se produce en el sector se compensa con la variación de la presión a la salida de la válvula, con objeto de mantener una presión uniforme en el punto crítico. Esta solución es el más adecuado para aquellas zonas con condiciones de suministro variables que requieran un control avanzado de la presión.
El control se puede realizar mediante un patrón prefijado, que tenga en cuenta la relación entre el caudal y la pérdida de carga en el distrito. Esta relación se deberá calcular o bien obtener mediante mediciones de campo, y deberá ser introducida en el sistema de control. De forma alternativa, el sistema de control se puede mejorar mediante su conexión vía radio o teléfono a un medidor de presión en el punto crítico, de forma que se ajuste la presión a la salida de la válvula para que no exista exceso de presión en el punto crítico en ningún momento del día. Esta segunda opción supone un mayor coste debido al sistema de comunicaciones necesario, aunque permite obtener un mayor ahorro de agua, así como garantizar los caudales requeridos para protección contra incendios, lo que hace que en ocasiones este tipo de control sea más ventajoso.

Costes
Los principales costes, que analizaremos posteriormente, y que hay que considerar al evaluar la rentabilidad de un sistema de gestión de presiones, son los siguientes:
Costes de diseño
Estos costes son los necesarios para estudiar y definir cuál es la alternativa más adecuada de gestión de presiones en cada sector. Como es evidente dependen mucho del tipo de red y de sus condiciones particulares. Puede incluir también, todas aquellas pruebas o estudios pilotos necesarios para encontrar la tipología más adecuada. Aunque cuantitativamente son costes no muy elevados, si que tienen una importancia capital. Pues de encontrar la solución óptima, depende que los beneficios esperados, y por tanto la rentabilidad de la instalación sea máxima. Un valor aproximado de estos costes estarían entre 4000 a 6000 por instalación.
Costes de construcción
En el presente apartado es valorar los costes de construcción de una cámara tipo para el alojamiento de los elementos de maniobra y control así como la valoración de suministro e instalación de estos elementos necesarios para una regulación de presiones. Existen múltiples disposiciones para realizar la gestión de presiones: de dos líneas en paralelo, de dos líneas en serie-paralelo, en tres líneas, etc. En la figura nº 2 se puede ver un ejemplo de una configuración típica serie-paralelo.

· Diámetro de entrada: 300 mm
· Diámetro de salida: 200 mm
· PN=16 atm
· Obra Civil:
- Movimiento de tierras:
- Cota roja: 2,50 m
- Talud de excavación: 1H:5V
- Anchura de trabajo en la base de la excavación: 0,50 m
· Hormigones:
- Espesor de hormigón de limpieza: 0,10 m
· Reposiciones:
- Espesor del firme de la calzada: 0,30 m
· Varios:
- Seguridad y Salud: 4% del P.E.M.
 de una cámara para válvula reguladora de presión")
Las principales actividades que engloba el mantenimiento y explotación, y que por tanto hay que tener en cuenta en el análisis de la rentabilidad del sistema, son las siguientes:
· Revisión periódica de las instalaciones.
· Suministro de energía eléctrica.
· Transmisión de datos vía GSM.
· Mantenimiento y reparaciones de obra civil.
· Mantenimiento y reparaciones de obra hidráulica.
· Mantenimiento y reparaciones de instalaciones electrónicas.
· Mantenimiento del telecontrol.
Estos costes se pueden expresar en función del coste de construcción, obtenido en el apartado anterior, de la obra civil, de la hidráulica y de las instalaciones electrónicas.
Ingresos
De todos los beneficios indicados anteriormente, los dos que vamos a considerar para evaluar la rentabilidad de un sistema de gestión de presiones son los siguientes: los ingresos derivados por el ahorro de agua, y los derivados por la reducción de averías y reparaciones. Los ingresos derivados por el ahorro de energía, pueden tener su importancia en aquellos sistemas en que los bombeos sea una parte esencial. En este caso, el ahorro producido estaría relacionado también con el ahorro de agua, y se podría valorar conociendo éste, las alturas de bombeo y el precio de la energía.
Obtención del ahorro de agua
La metodología más utilizada para evaluar la eficiencia de los sectores desde el punto de vista del coste utiliza los principios BABE (acrónimo de Burst and Background Estimate), desarrollado originalmente en el Reino Unido (UK Water Industry, 1994 a 1994g), con objeto de calcular los componentes de las pérdidas reales basado en los parámetros que tienen influencia sobre ellos. El objetivo de la metodología BABE es evaluar los componentes individuales de las fugas en una zona de suministro, y entonces comparar el valor estimado con el nivel de fugas obtenido a partir de un balance de agua anual o del análisis de caudales nocturnos, o preferiblemente de ambos.
Esta metodología no es una ciencia exacta, ya que esta basada en una serie de estimaciones e hipótesis, alguna de las cuales dependen de la disponibilidad de datos de buena calidad por parte de la compañía suministradora, otras son valores por defecto basados en promedios, y otras dependen del juicio ingenieril. No obstante, esto no resta validez a esta técnica, que pude considerarse similar a la modelización de redes de agua, en donde se utiliza una mezcla de datos medido en ensayos de campo y valores estimados.
De acuerdo con los conceptos BABE, las fugas se pueden dividir en varios componentes:
· Fugas latentes: este componente está formado por numerosas fugas que individualmente son pequeñas, con caudales comprendidos desde menos de 10 l/h hasta varios cintos de l/h, pero que pueden suponer una proporción significativa de las fugas totales, como consecuencia de que están presentes durante gran cantidad de tiempo. De hecho, muchas de las fugas latentes nunca van a ser reparadas, por lo que van a existir desde el momento que se produjeron hasta que el correspondiente componente de la red sea sustituido. La aparición de forma regular de nuevas pequeñas fugas, y el coste que supone su localización de forma individualizada, hacen que siempre exista una cierta cantidad de fugas latentes, a pesar de las operaciones de mantenimiento que reparan algunas de ellas. Estas fugas se producen normalmente en uniones y juntas de tuberías, válvulas, hidrantes, contadores, etc., tanto de la red de distribución como de las acometidas de los abonados.
· Roturas comunicadas: son aquellas que son puestas en conocimiento de la empresa suministradora, sin que hayan tenido que ser buscadas activamente. Esto puede suceder porque el agua llegue a la superficie y sea detectada por los viandantes, o bien porque la fuga produzca una reducción en el suministro de algunos abonados, con el resultado de presentar una reclamación a la empresa. Estas fugas suelen tener caudales más altos que las fugas latentes, normalmente entre 500 y 50.000 l/h (aunque puede existir alguna excepción), y son comunicadas a la empresa poco después de producirse. Se adopta un valor de 500 l/h puesto que normalmente se considera que es el mínimo caudal de fugas que puede ser detectado por técnicas acústicas, en el caso de tuberías metálicas enterradas con un recubrimiento normal de 1 metro. La reparación de estas fugas suele realizarse en un tiempo relativamente breve, con objeto de restablecer tanto el servicio de abastecimiento de agua como el de algún vial público que pueda haberse dañado como consecuencia de la rotura, por lo que su duración promedio suele ser de unas pocas horas o días. Por lo tanto, a pesar de que su caudal es elevado, el volumen total perdido por estas roturas es normalmente pequeño.
· Roturas no comunicadas: éstas tienen generalmente caudales más bajos que las comunicadas, pero mayores que las fugas latentes. Sólo se pueden encontrar mediante la realización de un control activo de fugas (siendo la monitorización de sectores uno de los métodos para llevar a cabo dicho control). Pueden estar presentes durante sólo unos días, pero pueden llegar a durar varios años, dependiendo de la intensidad con que se realice el control activo de fugas. Si no se efectúa dicho control activo, de forma que la empresa tan sólo interviene ante las roturas comunicadas, se dice que la empresa realiza un control pasivo de fugas, lo que sólo puede ser adecuado cuando el agua es abundante y barata, y no existe una regulación de la administración respecto a la reducción de fugas. Seguidamente se va a describir la metodología desarrollada (UK Water Industry, 1.994e y 1.994f).
El caudal mínimo nocturno está formado por una serie de términos:
· Caudal entregado a los consumidores: es el caudal que llega a los consumidores, con independencia de sus clase (doméstico, comercial, industrial, etc.). Éste a su vez puede descomponerse en dos términos, uno que agruparía las fugas producidas en las instalaciones interiores de los abonados, y otro que correspondería al consumo intencionado de agua. Existen diferencias significativas entre ambos términos, puesto que el primero estará formado por consumos de duración temporal elevada, a un caudal aproximadamente constante, mientras que el segundo corresponderá a consumos de menor duración con caudales variables, cuya modulación temporal puede estar laminada por la existencia de depósitos de almacenamiento.
Con respecto a las fugas producidas en las instalaciones interiores, hay que indicar que éstas tan sólo tienen en cuenta la fugas producidas entre el punto de entrega del agua (límite de la propiedad) y el punto de consumo (lugar donde está situado el contador individual), puesto que las fugas que se producen ayuso del contador, se considera que forman parte del consumo del abonado, ya que son susceptibles de ser medidas (si bien en muchos casos no lo son, debido a los pequeños caudales circulantes, y a la clase metrológica y estado de conservación del contador). Las fugas latentes de las instalaciones interiores dependen del estado en el que se encuentra la instalación, y pueden estimarse utilizando los valores indicados en la Tabla 2.

· Consumo nocturno excepcional: cualquier consumo individual, sea doméstico o nodoméstico, cuyo caudal supere la definición de una rotura (500 l/h), se considera como excepcional, y debe ser evaluado de forma separada. Estos usuarios pueden ser identificados a partir de los registros de los contadores. Para evaluar su consumo nocturno, normalmente se necesita disponer de un registro continuo de la lectura del contador durante la noche, o bien leer el contador a intervalos de 1 hora, entre la 1:00 h y las 5:00 h.
Algunos usuarios tendrán un consumo nocturno constante, mientras que el de otros mostrará una variación significativa de noche a noche, o de semana en semana. En este último caso, se deberán considerar diferentes registros de consumos nocturnos.
· Consumos nocturno doméstico: el caudal Qd en l/h debido a los usuarios domésticos con un consumo normal puede ser evaluado mediante:
Qd = Qv · Nv
Siendo:
Qv: valor promedio del consumo nocturno doméstico, en l/propiedad/h;
Nv: número total de propiedades en el sector.
Según diversos estudios realizados en el Reino Unido, el valor de Qv resulta 1,7 l/prop./h (o de forma equivalente 0,6 l/habitante/h). Se observa no obstante, que un pequeño porcentaje de viviendas activas con un consumo elevado puede tener una gran influencia en el caudal promedio nocturno, lo que explica que puedan observarse valores mayores o menores que el valor promedio, especialmente en pequeños sectores. El valor promedio del consumo nocturno doméstico (1,7 l/prop./h) puede ser considerado que provenga, de forma aproximada, de un 17% de viviendas activas que utilizan 10 l/h cada una, lo que da lugar a una gran variabilidad del consumo nocturno, sobre todo en pequeños sectores.

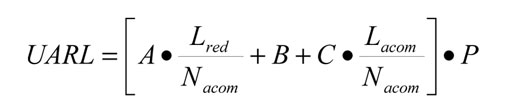
A = 18 l/km.día.mca
B= 0,80 l/km.día.mca
C= 25 l/km.día.mca
Lred = Longitud total de tuberías (transporte + distribución) (km)
Lacom= Longitud total de acometidas (km)
Nacom= Número de acometidas
P= Presión media de operación (mca).
Otro método similar, aunque simplificado, propuesto en 'Managing leakage' sugiere que el caudal nocturno se calcule a partir de la fórmula siguiente, donde únicamente se tiene en cuenta el número de acometidas y la longitud de las tuberías de distribución.
Qfl = F ·Na + G · L
siendo:
Qfl: caudal producido por fugas latentes en la red de distribución y acometidas en l/h;
F: caudal fugado por acometida, en l/acom./h;
G: caudal fugado por longitud de tubería, en l/km/h.
Los valores de F y G dependen del estado en que se encuentren las acometidas y la red de distribución, respectivamente, según se indica en la Tabla 4:

Puesto que el caudal mínimo nocturno depende de diversas variables, deben aplicarse factores correctores cuando se realiza una serie de mediciones, con objeto de tener los resultados referidos a una base común. Normalmente se consideran dos factores: el factor corrector de la presión y el factor corrector del periodo de muestreo, aunque dado que en este apartado se trata de estimar el caudal mínimo nocturno a partir de lo expuesto anteriormente y no de datos medidos, sólo se considerará el primer factor.
Con objeto de estandarizar los valores de los caudales nocturnos, se propone referir todos los caudales a una presión de 50 m.c.a., resultando los factores correctores de la presión (PCF) que vienen indicados en la tabla nº 5. Cuando se realiza una medición del caudal mínimo nocturno a una presión diferente de 50 m.c.a., se puede obtener un caudal estandarizado, dividiendo el caudal medido por el PCF correspondiente a la presión promedio nocturna de la zona (AZNP). Inversamente, las fugas latentes obtenidas mediante las tablas nº 3 y 4 pueden asimismo corregirse con este factor, si se pretenden realizar los cálculos a la presión a la que se han realizado las mediciones (en este caso las fugas latentes se multiplican por el PCF). Sin embargo, según la metodología propuesta se considera que el consumo intencionado de agua no depende de la presión, por lo que no se debe afectar con este factor.

· Evolución a lo largo de las 24 horas del día de:
- Caudal inyectado al sector en estudio.
- Presión en el punto de entrada
- Presión en el punto promedio (también denominado AZP o average zone point en inglés). Se suele adoptar el punto de red que tiene una cota promedio, con la máxima densidad de población.
- Presión en el punto crítico.
· Cotas de los siguientes puntos:
- Punto de entrada (ze).
- Punto promedio o AZP (zAZ).
- Punto crítico (zc).
La metodología de cálculo está basada en dos ecuaciones: por un lado la ecuación que relaciona los caudales de fuga a diferentes presiones; y por otro lado, una ecuación de pérdidas de carga que se utiliza para evaluarla para cada hora entre el punto de entrada, y los puntos promedio y crítico:
HL,AZP (t) = KAZP (t)* Q(t)2
HL,crit (t) = Kcrit (t)*Q(t)2
Siendo:
HL,AZP(t), HL,crit(t): pérdida de carga producida entre el punto de entrada y los puntos promedio y crítico, respectivamente para la hora t; KAZP(t), Kcrit(t): factor de fricción conjunto para el tramo comprendido entre la entrada y el punto promedio, y entre la entrada y el punto crítico, respectivamente para la hora t. Se considera que estos factores de fricción van a permanecer invariables cuando se realice la gestión de presión; Q(t): caudal inyectado en la hora t.
Obtención del ahorro obtenido por reducción de averías y reparaciones
Una de las más importantes ventajas de la gestión de presiones es la reducción en la frecuencia de rotura de las tuberías. Sin embargo, los estudios y la bibliografía relacionada con este aspecto es todavía reducida. Es probable que la rotura de una tubería ocurra cuando los esfuerzos generados por el medio ambiente y la operación del sistema actúan sobre las tuberías, cuya integridad estructural ha estado comprometida por, la picadura de la corrosión, la degradación, la fractura, el arrastre, el ablandamiento del material, la erosión producida por una cantidad significativa de fugas, una instalación inadecuada o por defectos de fabricación. Los tipos de rotura han sido clasificados (por ODay y Col., 1986) en tres categorías: (1) la rotura circunferencial causada por tensiones longitudinales; (2) las roturas longitudinales causadas por tensiones transversales (esfuerzo anular); y (3) las generadas en la unión tipo espiga-campana, causada por tensiones transversales en las juntas de las tuberías.
Esta clasificación puede complementarse por tipo adicional, como lo es la de los orificios debidos a la corrosión. Las roturas circunferenciales debidas a los esfuerzos longitudinales es típicamente el resultado de una o mas de las siguientes ocurrencias: (1) la contracción térmica, debido a una baja temperatura del agua en las tuberías y del medio que las recubre, actuando sobre una tubería restringida de movimiento; (2) el esfuerzo flector (fallo en viga) debido al movimiento diferencial del suelo (especialmente en terrenos arcillosos) o a los grandes vacíos en el lecho de la tubería como resultado de las fugas; (3) una zanja y ejecución del lecho inadecuados; y (4) la interferencia por parte de terceros (por ejemplo, roturas accidentales, etc.). La contribución de la presión interna en la tubería a la tensión longitudinal, aunque pequeña, puede aumentar el riesgo de las roturas circunferenciales cuando ocurre simultáneamente con uno o más de las otras fuentes de tensión.
Las roturas longitudinales debido a las tensiones transversales es típicamente el resultado de uno o más de los siguientes factores: (1) la tensión anular debido a la presión en la tubería; (2) la tensión anular debido a la carga de la cobertura de tierra; (3) la tensión anular debido a las cargas vivas causadas por el tráfico; y (4) el aumento de las cargas anulares, debido a la humedad congelada expandida sobre el suelo, cuando se produce una penetración de las heladas. Como hemos mencionado anteriormente, no hay muchos estudios relacionados con este tema. Lambert (2.001) y Trow (2.003) sugieren que el cambio en la frecuencia de rotura puede ser referido a una potencia del cambio de presión. Es decir:
B1/B0 = (P1/P0)N2
donde
B1 es la frecuencia de rotura después de la gestión de presiones,
B0 es la frecuencia de rotura antes de la gestión de presiones,
P1 es la presión después de la gestión de presiones,
P0 es la presión antes de la gestión de presiones,
N2 es el exponente que hay que ajustar.
Estudios recientes en el Reino Unido (UKWIR, 2.003) concluyen que no hay una relación convincente entre frecuencias de rotura y presiones antes y después de la gestión de presiones; pero el mismo estudio revela que una relación basada en el cuadrado de la relación de presiones frente a la relación de roturas puede ser usada del lado de la seguridad, como el peor de la predicciones por efecto de la gestión de la presión, teniendo en cuenta que los resultados obtenidos deberían mejorarse, debido al efecto estabilizador de la gestión de presiones. Thornton y Lambert (2.005) sugieren que N2 debe estar comprendido entre 0,5 y 6,5.
Hay que considerar dos aspectos en el ahorro por reducción de averías y reparaciones. Por una parte el derivado de los trabajos de localización de la fuga o avería, que se pueden estimar alrededor de unos 350 /Ud. Por otra parte, los propios de la reparación de la avería, que como se puede comprender, puede variar bastante en función de las características de la tubería y del tipo de reparación que se tenga que hacer.
Rentabilidad
En los apartados anteriores hemos analizado las posibles soluciones para la regulación de la presión, cada una de las cuales debe adaptarse a las condiciones del sector en estudio, produciendo unos beneficios que deben ser estimados según los procedimientos mencionados. Asimismo, cada solución tendrá un coste, que debe ser comparado con el beneficio para determinar la viabilidad económica de la gestión de presiones en el sector y el sistema de control más efectivo. El análisis de rentabilidad también nos ofrece una prelación de actuaciones, al comparar todos los sectores desde un mismo punto de vista.
La comparación entre el coste y beneficio se puede realizar calculando una serie de ratios normalmente utilizados. Estos son:
· Valor Actual Neto (VAN): se llama Valor Actual Neto, o valor presente, de una cantidad 'S' a percibir al cabo de 'n' años, con una tasa de interés 'i', a la cantidad que, si se dispusiera de ella hoy, nos generaría al cabo de 'n' años la cantidad 'S'.
Lo habitual en un proyecto de este tipo es contar con un primer desembolso para el total de la inversión y, en periodos sucesivos tener unos flujos de caja (ingresos-gastos) que en general serán variables. Para aceptar un inversión deberá tener un VAN positivo, lo cual significa que la valoración de los flujos de caja, o cashflows, es superior al desembolso inicial de la misma. Entre dos proyectos será más rentable el que tenga un VAN superior.
· Tasa Interna de Retorno (TIR): la Tasa Interna de Retorno es el valor de la tasa de interés que hace nulo el Valor Actual Neto. Esta tasa interna se puede interpretar como la tasa de interés que el proyecto de inversión es capaz de proporcionar y, por tanto, si es superior a la tasa de interés a la que la empresa puede obtener fondos, la inversión será en general deseable, siempre y cuando este incremento compense el grado de riesgo que la empresa asume al acometer el proyecto. Entre dos proyectos comparables, siempre será más rentable el que tenga un TIR superior.
· Periodo de retorno (Pay-Back): se define el Periodo de retorno como el plazo de tiempo que ha de transcurrir para que la inversión se recupere. Más concretamente es el número de periodos necesarios para que la diferencia entre el flujo de caja acumulado y la inversión del proyecto sea nula. En este sentido un proyecto será tanto más rentable, cuanto menor sea su periodo de retorno.
Aplicación práctica
Como aplicación práctica de lo anteriomente citado, se desarrolla un ejemplo. Los datos necesarios son los siguientes:
· Número de habitantes del sector: 23000
· Longitud de las tuberías del sector: 25,0 km.
· Número de acometidas: 975.
· Cota en el punto de entrada (Ze): 310,00.
· Cota en el punto promedio o AZP (ZAZP): 307,80.
· Cota en el punto crítico (Zc): 307,50.
· Presión mínima admisible en la red: 25 m.c.a
· Caudal esperado en fugas latentes en distribución (Qfld): 40 l/km/h
· Caudal esperado en fugas latentes en acometidas (Qfla): 2 l/acom./h
Por lo tanto: El caudal de fugas latentes se estima en 2950 l/h; y el caudal mínimo nocturno en 13800 l/h. En la Figura 3 se muestran las curvas de comportamiento del sector: caudal y presiones a la entrada, en el AZP, y en el punto crítico. Es importante señalar que el volumen entregado diario es de 2225700 litros.

Cálculos
2. La componente del caudal dependiente de la presión en el momento de mínimo consumo es: 37214,00 l/h.
3. Los valores del caudal dependiente de la presión en el resto del día son los que se muestran en la Tabla 6.


Soluciones

")
· Caudales mayores de 20 l/s, las presiones se reducen a 36 m.c.a.
· Caudales inferiores a 20 l/s, las presiones se reducen según la fórmula: p=0,13 q +34,6
Los resultados se muestran en la Tabla 9.

")
Rentabilidad

- RS Mckenzie; H Mostert and T de Jager. Leakage Reduction through Pressure Management in Khayelitsha: two yeas down the line. 2004
- A.O. Lambert; Timothy G. Brown; M. Takizawa, D. Weimer. A Review of Performance Indicators for Real Losses from Water Supply Systems. 2000
- Ronnie Mckenzie. Pressure Management Program. 2001
- Vicente García Carrasco y Jorge García-Serra García. Control y Reducción de Fugas mediante la Sectorización y la Gestión de Presiones.