Automatic segmentation of images of crops: comparative study of models of colour
G. García-Mateos and S. Jaén Clods (Dep. Of IT and Systems. Faculty of IT. University of Murcia)
D. Escarabajal-Henarejos And J.M. Molina-Martínez (Group of Inv. In Engineering Agromótica and of the Mar. Polytechnical University of Cartagena)
J.L. Hernández-Hernández (Academic Unit of Engineering. Autonomous university of Guerrero, Mexico)
15/04/2014Introduction
The problem of the automatic segmentation am used to/silver has been widely studied by diverse researchers, as it can check in two recent reviews of the state of the art (Lin et al., 2013; McCarthy et at., 2010). In the majority of these works the classification does using diverse technicians like umbralización, discriminantes linear, models of gausianos, fuzzy logic, neural networks, and others; but the space of colour is fixed in advance, and throw in lacking comparative studies on the effectiveness of diverse models of colour in plants. However it is usual to find this type of comparative works other commands. For example, Shih and Lui (2012) evaluated comparatively 12 spaces of colour in applications of processings of faces, and arrived to the conclusion that the optimum spaces are YUV and YIQ; Luszczkiewicz-Piatek (2014) studies the election of the space of colour for the recovery of images in big databases; the colour represents with models of mix of gaussian and analyse 11 spaces of colour. By his part, Terrillon and Akamatsu (2000) entered the space TSL, and compared 9 spaces in the detection of faces.
In consequence, the aim of this work is to realizar a complete and exhaustive study, with the purpose to select the space of optimum colour and the most effective form to represent the distributions of colour for the problems of classification in the command agromótico, and in concrete for the automatic segmentation of plants in images.
Materials and methods
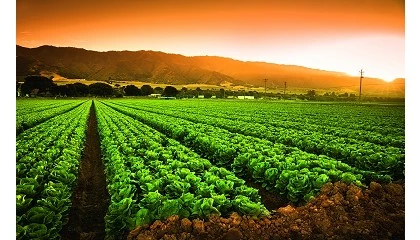
Images used for the experimentation
 An overview of one of the plots with the area of interest signalled...")
Classification and representation of the colour
The concrete colour of a pixel of the floor, or of the plants, can understand like a stochastic event inside the space n-dimensional defined by the space of colour used. In the case of the floor, the distribution of probability of the colour is determined by the type and composition of the floor, the lighting in the moment to take the photo and the own parameters of the camera, like the balance of whites; of similar form occurs with the colour of the vegetal coverage, where the chlorophyl gives place to the predominancia of the green tones.
Suppose known the functions of distribution probability of the colour of the floor, pam used to(colour), and of the colour of the plant, pplants (colour), where colour is a tupla of a space of colour any one. Considering equiprobables the probabilities a priori of floor and of plant, the probability that a pixel, colour, concrete was of plant or of floor, can calculate of simple form by means of the rule of Bayes, given by the formula:
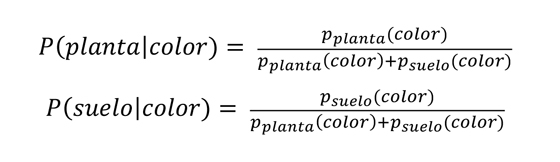
In consequence, the concrete pixel is assigned to the class of greater probability between P(plants|colour) and P(am used to|colour). Of trivial way, the problem reduces to look for the maximum between pplants(colour) and pam used to(colour) for each pixel of the images.
The classification pixel-to-pixel obtained of this form can improve with the application of operations of local processing, that take into account the vecindad of the pixels. In concrete, have checked two options: reduction of the image by 2 using interpolation of supermuestreo, and operations of mathematical morphology. Whereas the first achieves to reduce the level of noise of the images (when doing a promediado of pixels), the second allows to clean the result of values espurios. Besides, both operations can apply of form combined.
Spaces of colour analysed
The forms that adopt the functions of distribution of probability, pam used to and pplants, depend, logically, of the space of colour adopted. Each space generates distinct degrees of separation between the distributions, affecting like this the effectiveness of the classification. The models of colour selected for the study, chosen between the most usual in applications of artificial vision (Luszczkiewicz, 2014), are the following:
- RGB, rgb. The space RGB is the most extended in devices of capture and generation of colour. It bases in a model of additive mix, where each colour forms by combination of the three primary colours: red (R), green (G), and blue (B). From this model defines the variant normalised rgb, that consists in dividing the values of RGB by (R+G+B).
- XYZ. Is a model that simulates the answer of the three types of fotorreceptores of the retina (those with spectrums of absorption in lengths of high waves, half and drops). The concrete form of these spectrums of absorption was defined by the CIE (Commission internationale of l'éclairage) in 1931.
- HSV, HLS. In these models the colour decomposes in terms easily interpretable like the intensity (V, L), the saturation or purity (S), and the nuance of colour (H). They are models very usual in analysis and graphic generation.
- YCrCb, YUV. Treats of models oriented to compressesion and transmission of images. They base in the separation of a channel And of luminance (or luminous intensity), and two channels of crominancia (or tone of the colour, independent of his luminosity). The channels Cr and Cb correspond, in essence, to the channels R and B normalised in intensity, respectively.
- L*to*b*, L*or*v*. These models were defined by the CIE for industrial applications of the colour. Of similar form to the previous, separate a channel of luminosity (in this case L*) and two channels of crominancia (to*-b* and or*-v*). These last define by means of transformations no linear of the model RGB, with the end to achieve representations perceptualmente uniforms of the colour.
- TSL, I1I2I3. Some models have been designed specifically for some applications. For example, the model TSL was created to tackle problems of detection of human leather (Terrillon and Akamatsu, 2000). On the other hand, I1I2I3 proposed for the segmentation of colour, like a decorrelación of the components RGB using the transformed Karhunen-Loeve.
Representation of the distributions of probability of colour
To his time, exist distinct alternatives in the representation of the histograms. In the first place, the number of channels to use, since no all the channels are equal of useful for the problem. As we will see, descartar some channels can produce better resulted that use them all. Second, have the size of the histogram. The histograms suppose a discretisation of the rank of the variables studied. The discretisation does in powers of 2, what allows to obtain a uniform distribution of the values of entrance, represented with bytes. In definite, for each one of the spaces of colour, have the option to use histograms of a channel, two channels or three channels, with 16, 32, 64, 128 or 256 cells by dimension.
Results and discussion
Like second experiment has realizar an automatic classification of the images of the second sequence (a total of 61 images), comparing the result with the manual classification of the experts. The value obtained in this case is the percentage of final tarpaulin to level of pixel for each option.
 and floor (in red) for the spaces of colour analysed...")
Solapamiento Between distributions and tarpaulin of classification
Can stand out some notable facts. As it was to expect, the solapamiento diminishes with the number of channels and with the size of the histograms. However, whereas in the first factor the reductions are very significant, in the second do not reach 30% of reduction in the best cases. Besides, big sizes of histograms increase the risk of 'sobreajuste' to the data of learning.
The channel that by himself only achieve better results is the to* of the L*to*b*, with only 0,95% of solapamiento and 99,2% of tarpaulin. The best result obtains for 32 cells, although the results are also very good for 64 and 128. The following options, to more distance, are channels I3 in I1I2I3, Cr in YCrCb, V in YUV, or* in L*or*v*, H in HSV/HLS, and T in TSL, with precisions always upper to 96%. By his part, any of the channels of RGB is able by himself only to achieve a solapamiento low, as neither the channels of luminosity of the distinct spaces.

Finally, have selected some of the configurations that produce better results and on them have applied the additional improvements before described: reduction by 2 of the images; application of mathematical morphology; and the combination of both. In the figure 3 can see some examples of automatic segmentation including these improvements. The complete results can see in the table 2, that shows also the times of execution in a half computer.


Conclusions
Of this study can conclude several facts. First, that the classification by colour results viable in the practice when producing some results of 99,5% of tarpaulin in the classification, requiring only 0,3 seconds by image in a standard computer. Segundo, that the best models of colour are those that separate a channel of luminance and two of crominancia, where the seconds are those that contribute the notable information for the problem. In concrete, the space L*to*b* has showed to be above the rest in the majority of the cases; the space RGB, in spite of being one of the most widespread, would not have to be used for the automatic classification. Finally, the application of operations of pre- (reduction of the images with supermuestreo) and post-processing (operators of mathematical morphology) is very useful to improve the results and reduce the times of execution. At present, the team of investigation is working in the implementation of applications to level of user to realizar the automatic segmentation in mobile devices, using the results of this study.
Bibliographic references
- Allen, R.G., Pereira, L.S., you Scrape, D., Smith, M. 1998. Crop evapotranspiration-Guidelines for it crop water requirements-FAO Irrigation and drainage paper 56. FAO, Rome 300, 6541.
- Cubero, S., Aleixos, N., Moltó, And., Gómez-Sanchis, J., Blasco. J. 2011. Advances in machine vision applications for automatic inspection and quality evaluation of fruit and vegetables. Food and Bioprocess Technology, Vol. 4 (4):487-504.
- Fernández-Pacheco, D.G., Escarabajal-Henarejos, D., Ruiz-Channels, To., Conesa, J., Molina-Martínez, J.M. 2014. To new digital image processing based methodology for determining Kc in lettuce crops in the Southeast of Spain. Biosystems Engineering 117:23-34.
- Kumar, P., Sengupta, K., it Reads, To. 2002. To comparative study of different colour spaces for foreground and shadow detection for traffic monitoring system. Intelligent Transportation Systems:100-105.
- Lin, K., Chen, J., If, H., Junhui, W. 2013. To review on computer vision technologies applied in greenhouse plant stress detection. Advances in Image and Graphics Technologies, 363, 192200.
- Luszczkiewicz-Piatek, M. 2014. Which Colour space should be chosen for robust colour image retrieval based on mixture modeling. Advances in Intelligent Systems and IT. Vol. 233:55-64.
- McCarthy, C.L., Cheryl, N.H., Hancock, S.R. 2010 Applied machine vision of plants - to review with implications for field deployment in automated farming operations. Intelligent Service Robotics, 3 (4), 209217.
- Shih, P., Liu, C. 2005. Comparative assessment of content-based face image retrieval in different Colour spaces. Int. J. Patt. Recogn. Artif. Intell. 19(7), 873-893.
- Terrillon, J.C., Akamatsu, S. 2000. Comparative performance of different chrominance spaces for Colour segmentation and detection of human faces in complex scene images. International Conf. on Face and Gesture Recognition, 54-61.